
Above is a picture of our map. Every shape represents the exact location of all 67 bridges we are investigating. Each color and shape of the icons represent an important detail about the bridge.
Shape: Owner
1. Circle = City or Municipal Highway Agency
1. Circle = City or Municipal Highway Agency
2. Star = State Highway Agency
3. Rhombus = Railroad
4. Heart = County Highway Agency
Color: Maintainer
1. Blue = City or Municipal Highway Agency
2. Red = State Highway Agency
2. Red = State Highway Agency
3. Green = Railroad
4. Yellow = County Highway Agency
All of the icons can be selected and show a data block of more useful information includes the bridge ID number, common name, year it was built, owner, maintainer, latitude, and longitude.
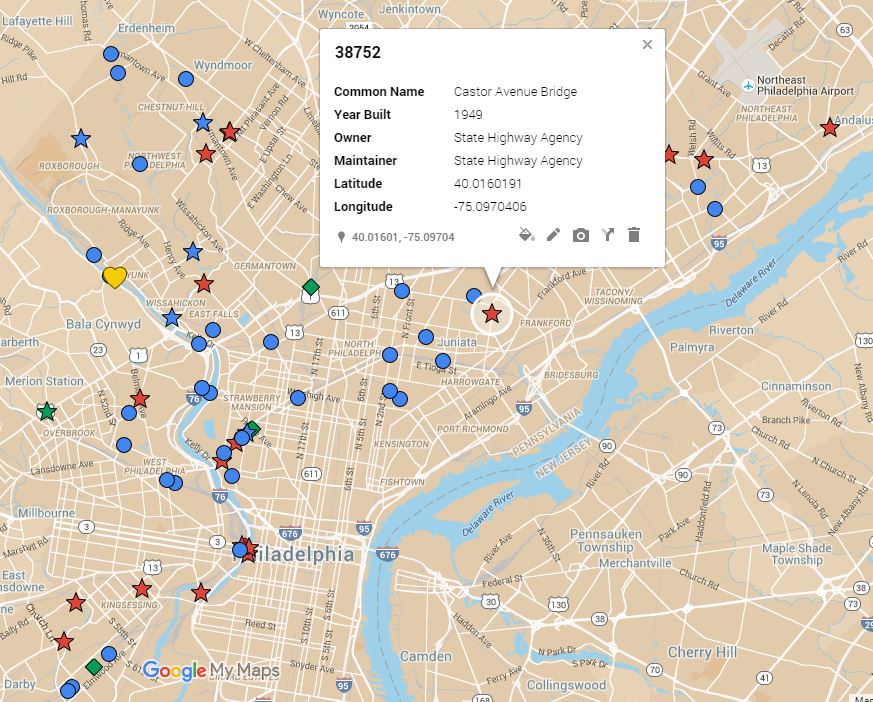
Above shows the data block that appears for all of the bridges when they are selected.
No comments:
Post a Comment